Ciaro Dashboard
Overview
Streaming high-frequency Google Ads click-event telemetry, bot pattern flags, and proxy/VPN IP metadata in real time overwhelmed the client thread: unthrottled state dispatches caused UI lag and high INP (~290ms), forensic inspection drawers caused frame drops during opening transitions, and toggling between standard and advanced data views caused jarring visual layout shifts.
Engineered a high-performance Next.js App Router dashboard using Zustand for transient UI states (drawers, filter queries, view modes) decoupled from the TanStack Query server cache. Implemented a custom requestAnimationFrame event-batching pipeline flushing telemetry at a stable 60Hz tick, rendered threat charts using ECharts SVG with React concurrent transitions, animated GPU-accelerated slide-over inspection drawers, and enforced fixed CSS Grid track anchors for zero Cumulative Layout Shift.
Technical Bottlenecks & Architectural Constraints
Streaming high-frequency Google Ads click-event telemetry, bot pattern flags, and proxy/VPN IP metadata in real time overwhelmed the client thread: unthrottled state dispatches caused UI lag and high INP (~290ms), forensic inspection drawers caused frame drops during opening transitions, and toggling between standard and advanced data views caused jarring visual layout shifts.
Core Implementation Hurdles & Engineering Solutions:
High-Frequency Click Stream Ingestion Throttling
High-volume ad campaigns produced up to 50 telemetry events per second, causing React render queue exhaustion and input latency spikes.
↳ Developed a custom requestAnimationFrame batching hook that buffers incoming events and flushes batched state updates at a synchronized 60Hz tick.
Zero-CLS Density Mode Transitions
Switching between Normal and Advanced view modes swapped component trees, causing noticeable layout jumps and Cumulative Layout Shift.
↳ Preserved shared CSS Grid track structures with CSS content-visibility hints, ensuring identical layout anchors during view complexity changes.
Hardware-Accelerated Forensic Inspection Drawers
Rendering extensive session metadata, IP lookup tags, and raw click payload trees inside sliding drawers triggered frame drops during gesture animations.
↳ Offloaded drawer slide transitions to the GPU compositor thread using CSS transform: translateX with will-change hints, mounting heavy list items inside virtualized subtrees only after transition completion.
Front-End Performance Budgets & Quality Gates
Drawer Slide Frame Rate
Target Budget: 60 FPS Sustained
Measured via Chrome DevTools Rendering HUD during drawer opening transitions. Animated drawer slide-over using CSS transform: translateX on GPU compositor thread.
Interaction to Next Paint (INP)
Target Budget: < 200ms
Measured via Chrome Web Vitals extension during live click-stream data updates. Batched incoming telemetry events and memoized budget calculation selectors.
Cumulative Layout Shift (CLS)
Target Budget: < 0.05
Audited using Lighthouse CI in production build across view mode switches. Reserved fixed grid tracks for analytics charts and metric cards across view mode toggles.
Interface & Architecture Showcase
Executive Telemetry Cockpit & Advanced Density View
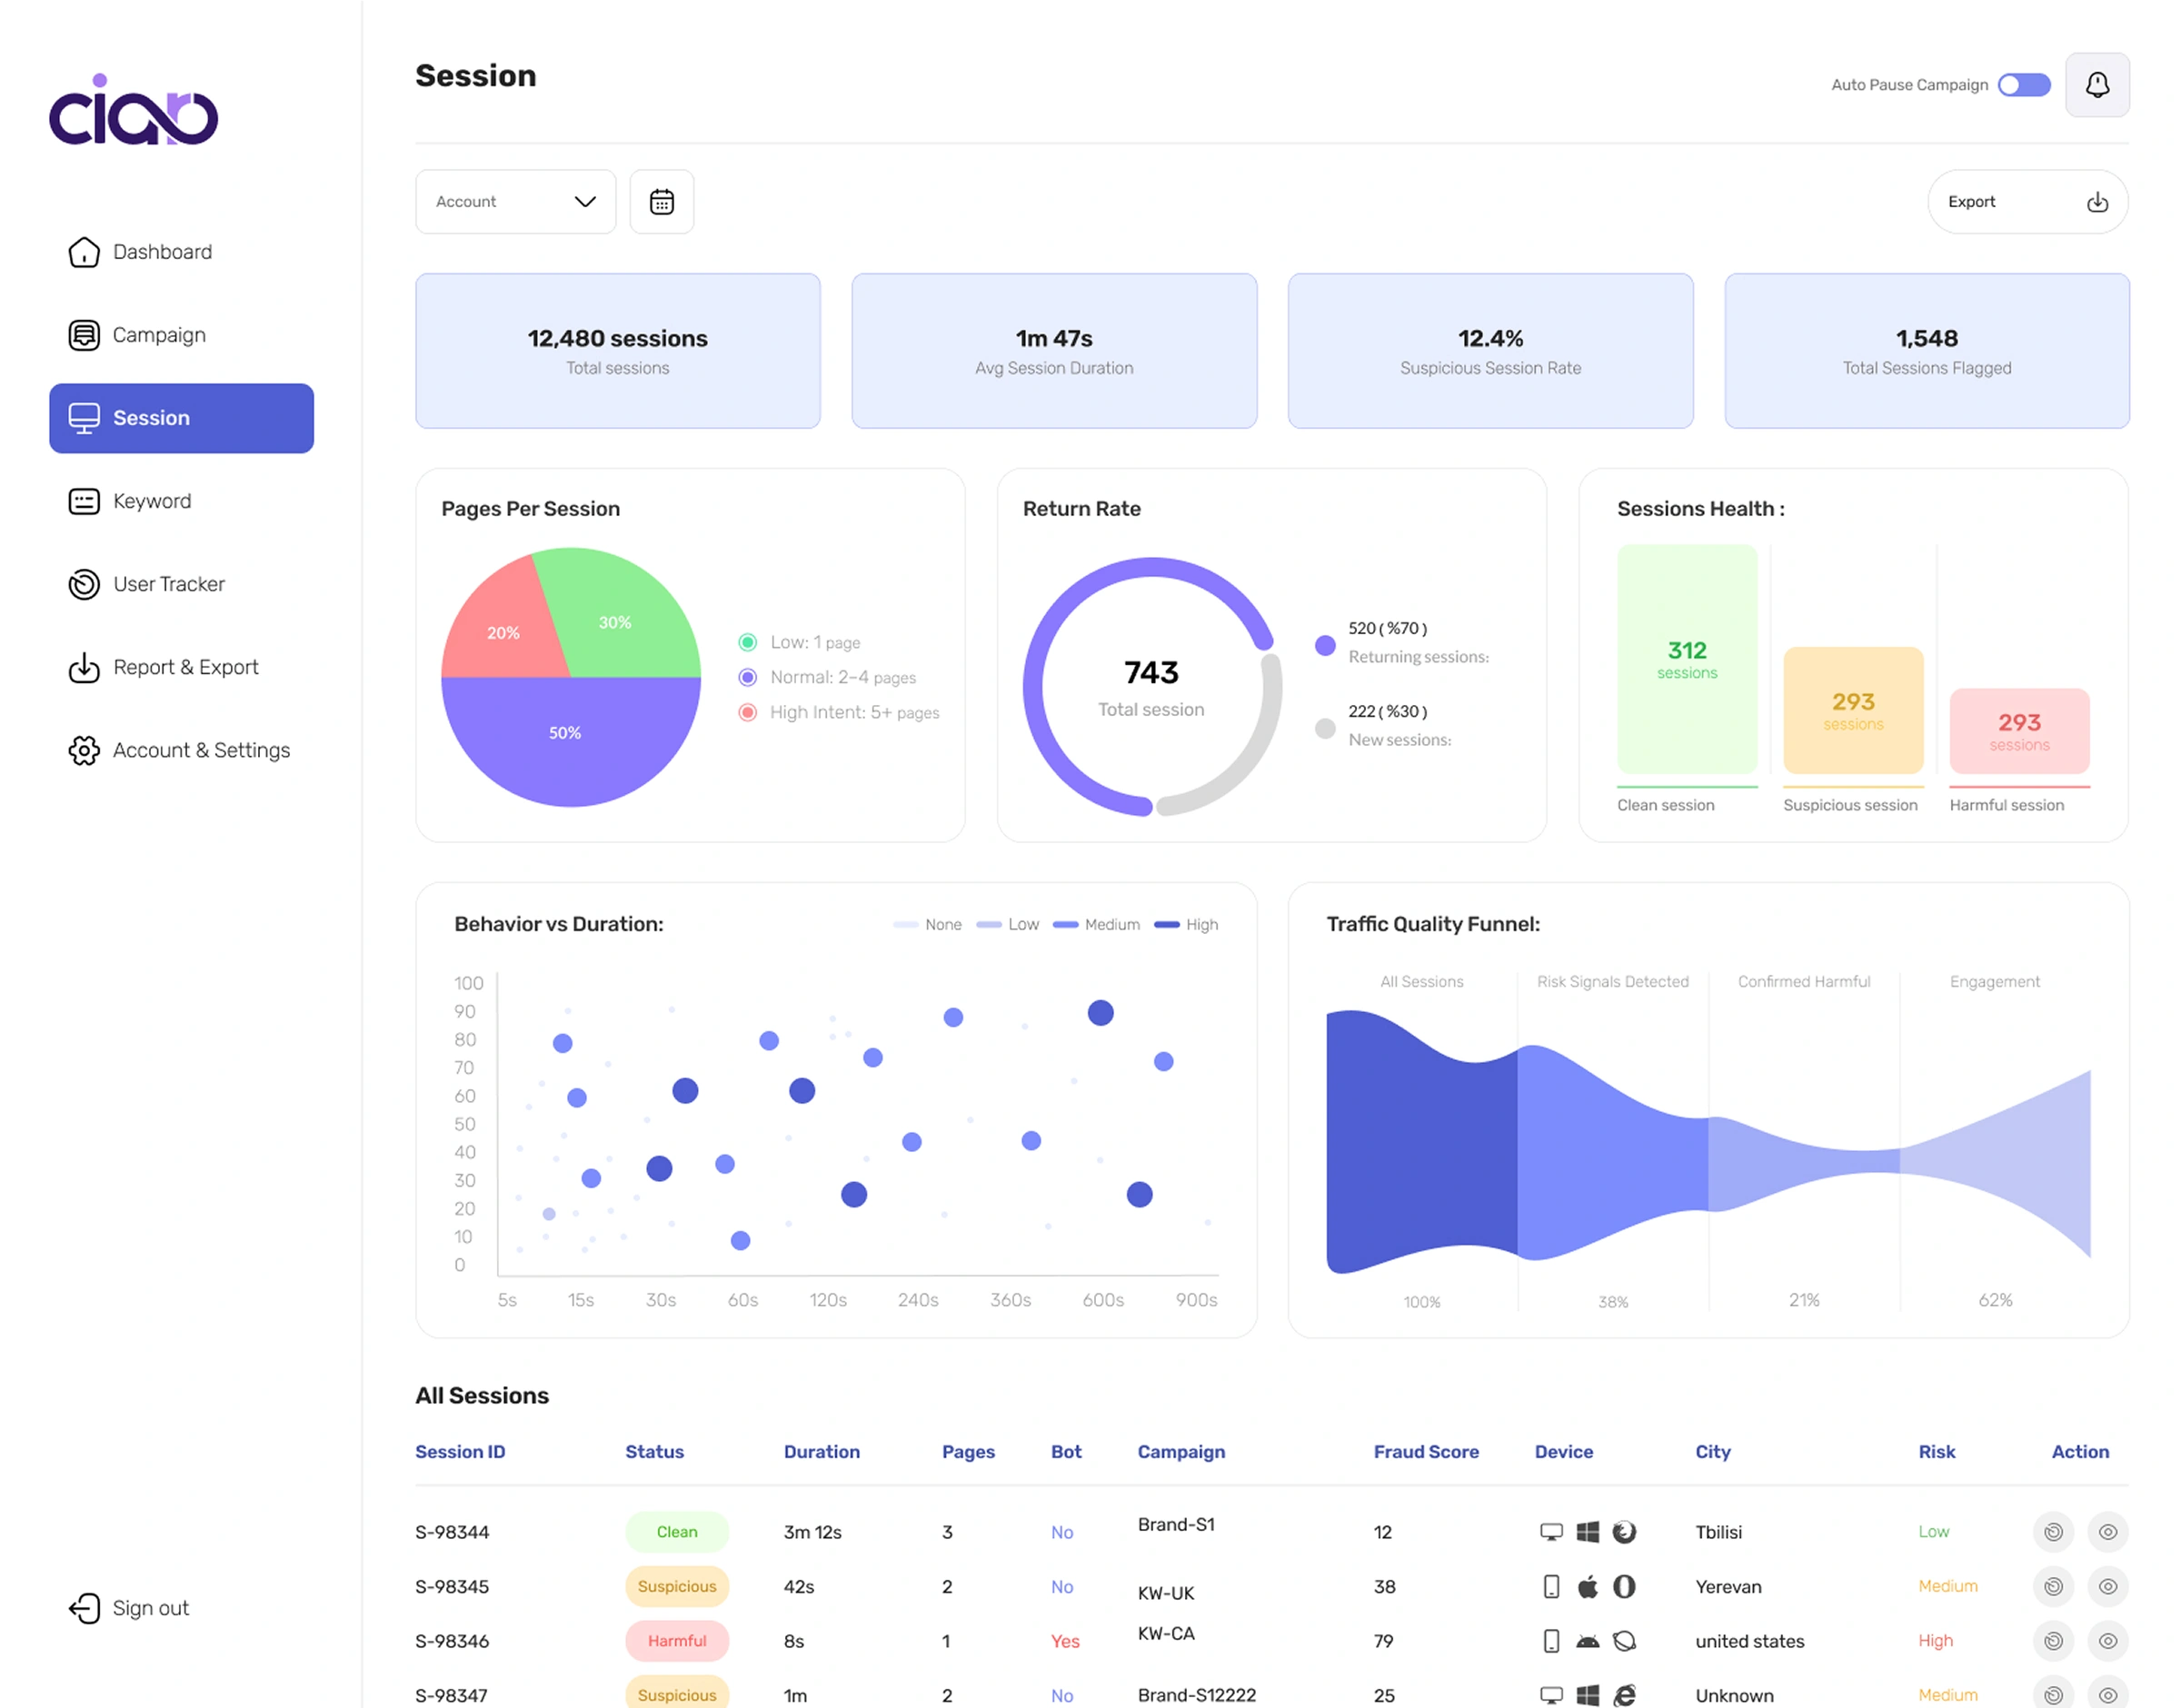
High-density threat monitoring cockpit displaying real-time click volumes, bot detection ratios, and ad account telemetry. Engineered with dynamic viewport scaling between standard and advanced layouts with zero Cumulative Layout Shift (CLS).
Session Forensic Inspection & Threat Analysis Drawer
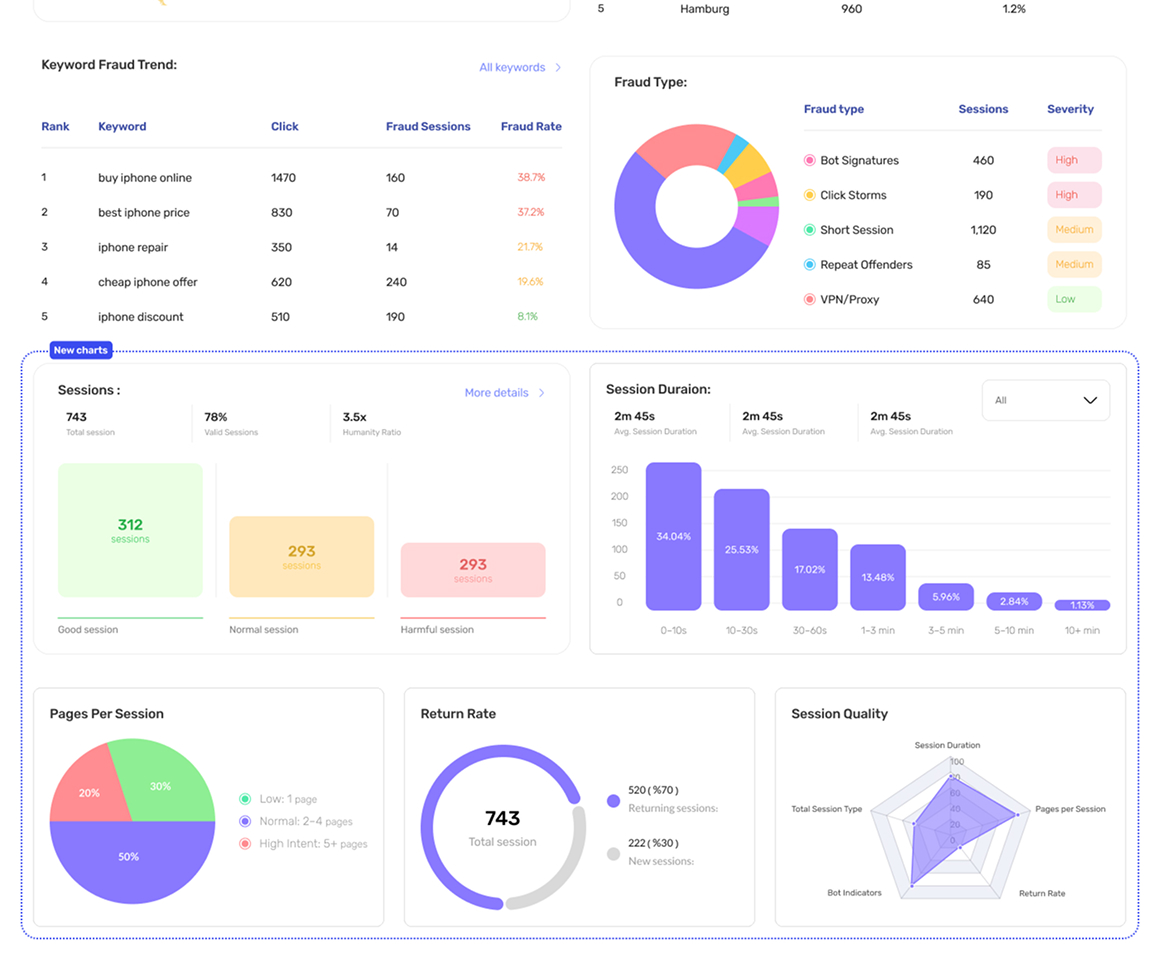
Forensic session inspector displaying click chains, VPN/proxy metadata flags, and user-agent fingerprints. Built with virtualized list rendering, keyboard focus trapping, and GPU-accelerated transform transitions.
Protected Budget Engine & Ad Spend Telemetry
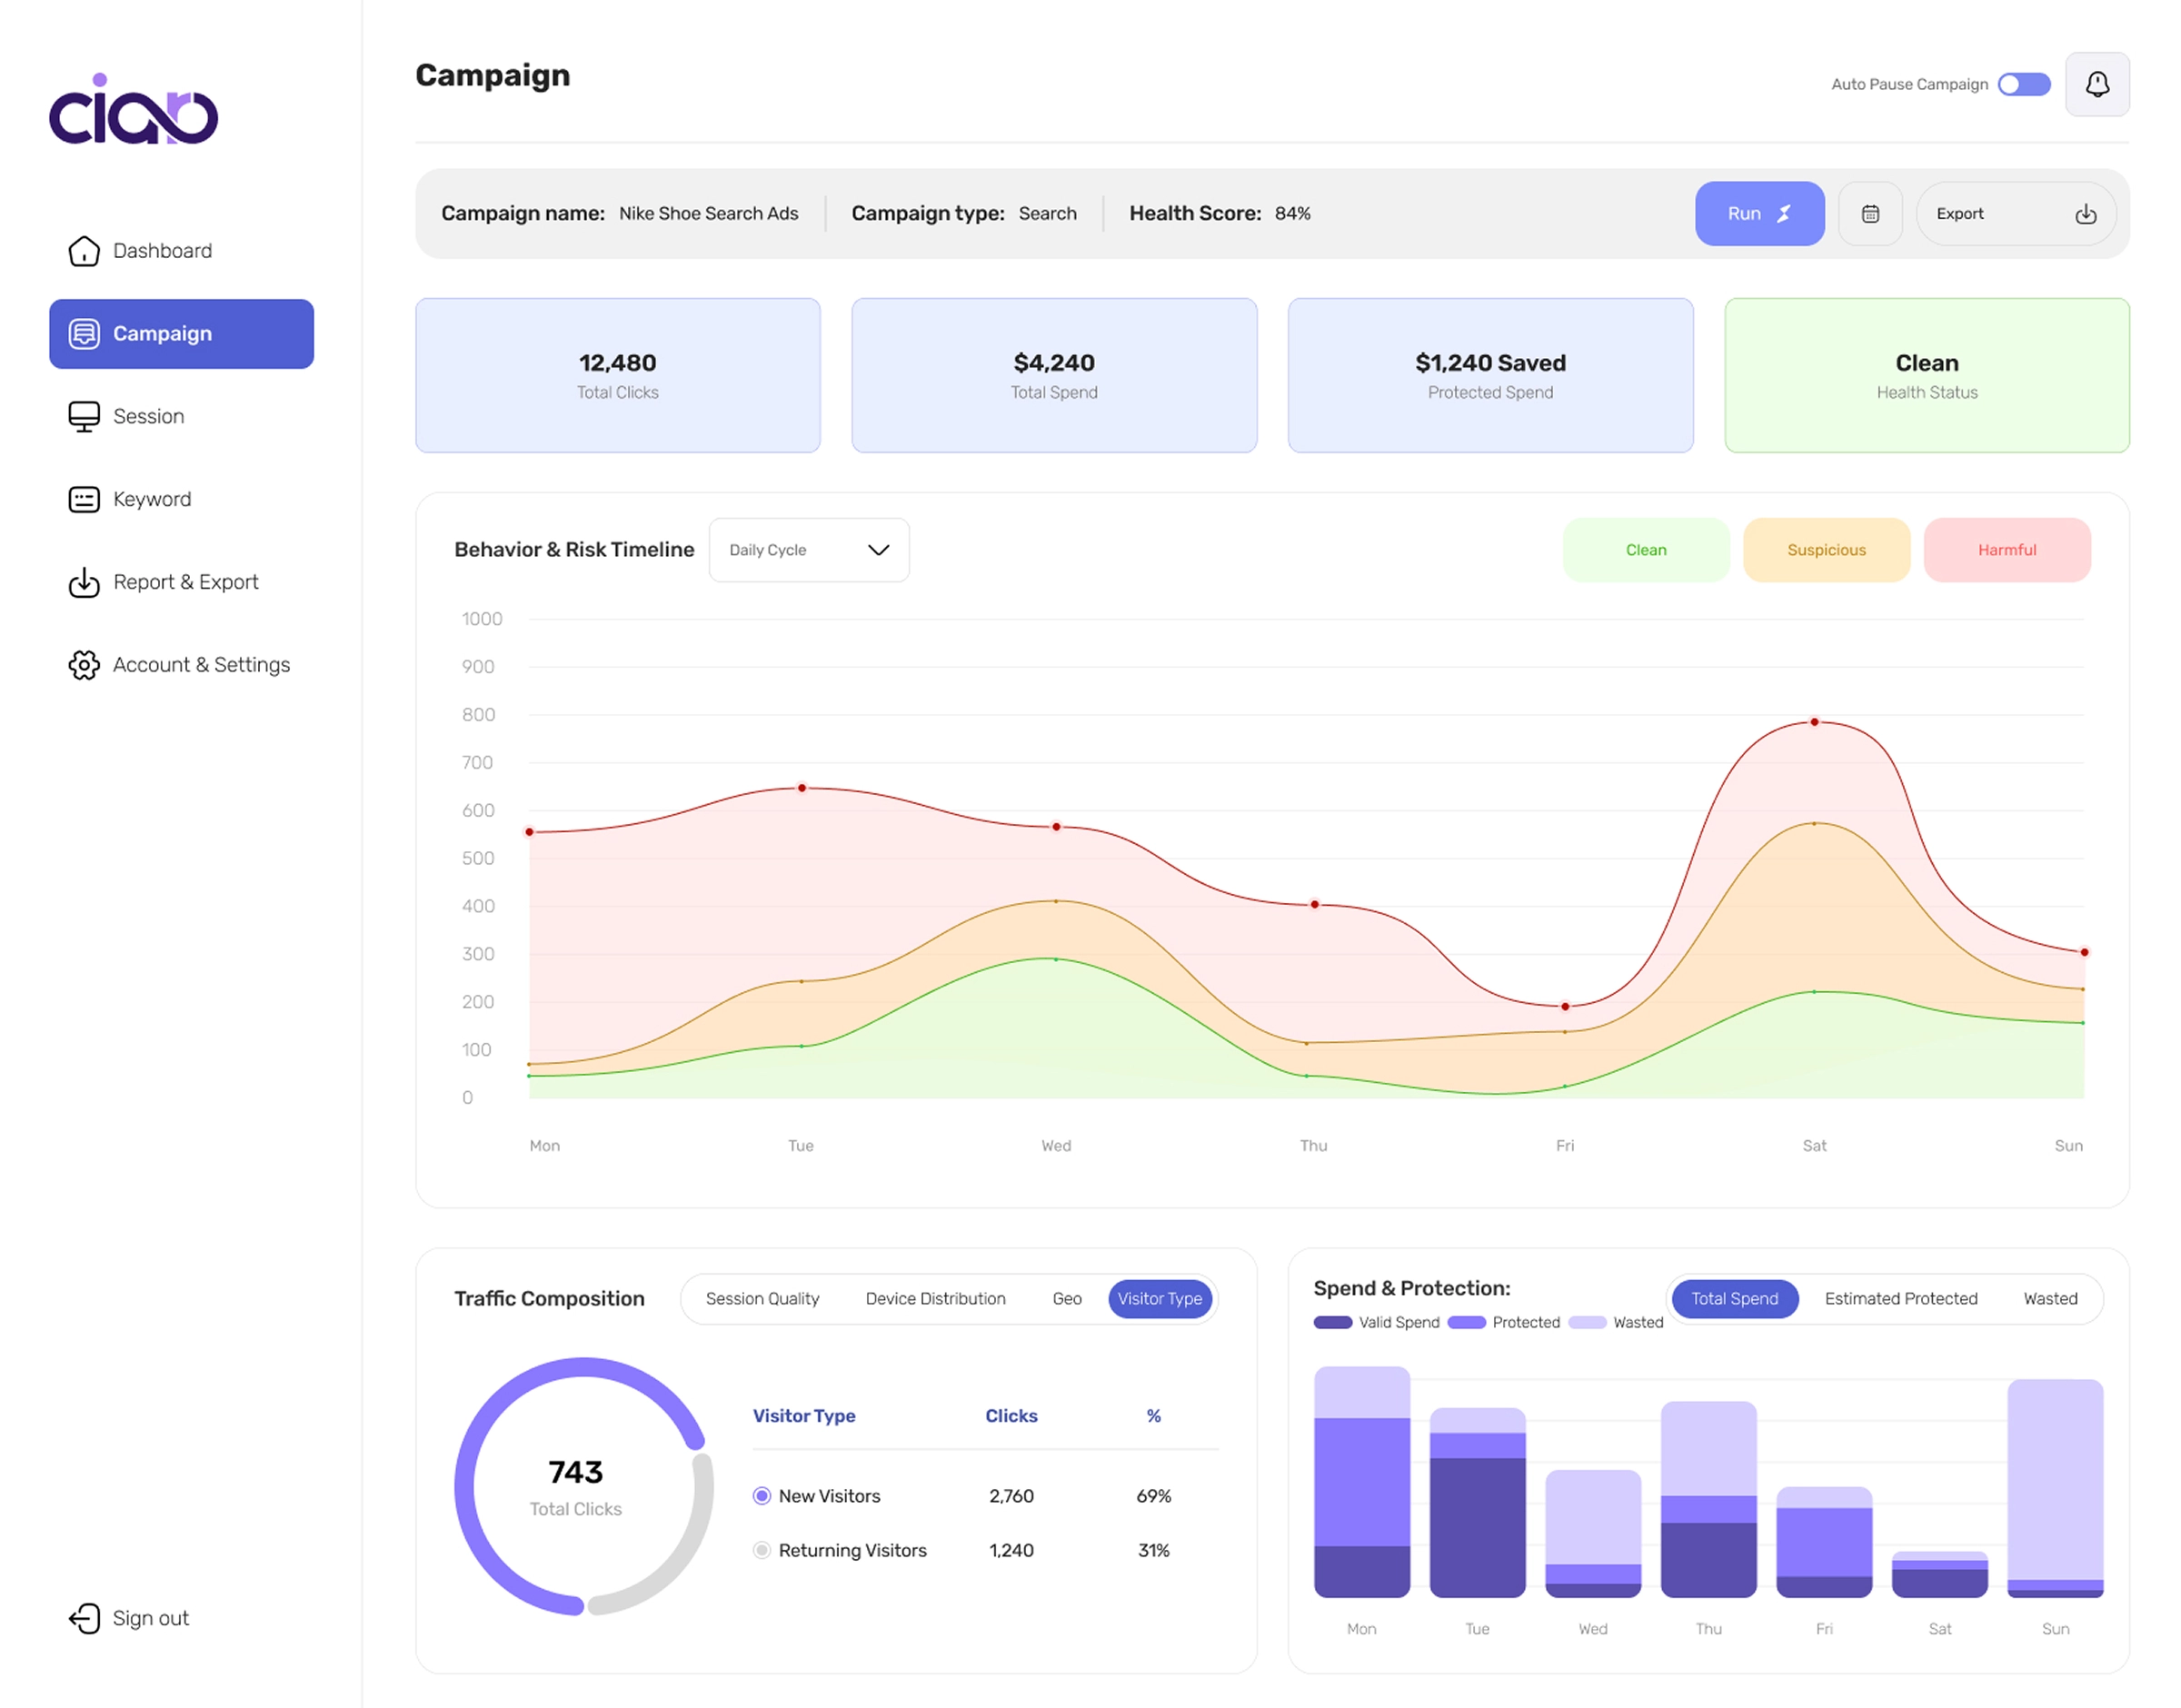
Real-time financial protection visualizer computing saved ad spend (blocked fraudulent sessions multiplied by real-time average CPC). Driven by memoized client-side aggregate hooks with zero main-thread calculation blocking.
Live Action Feed & Automated Threat Mitigation Stream
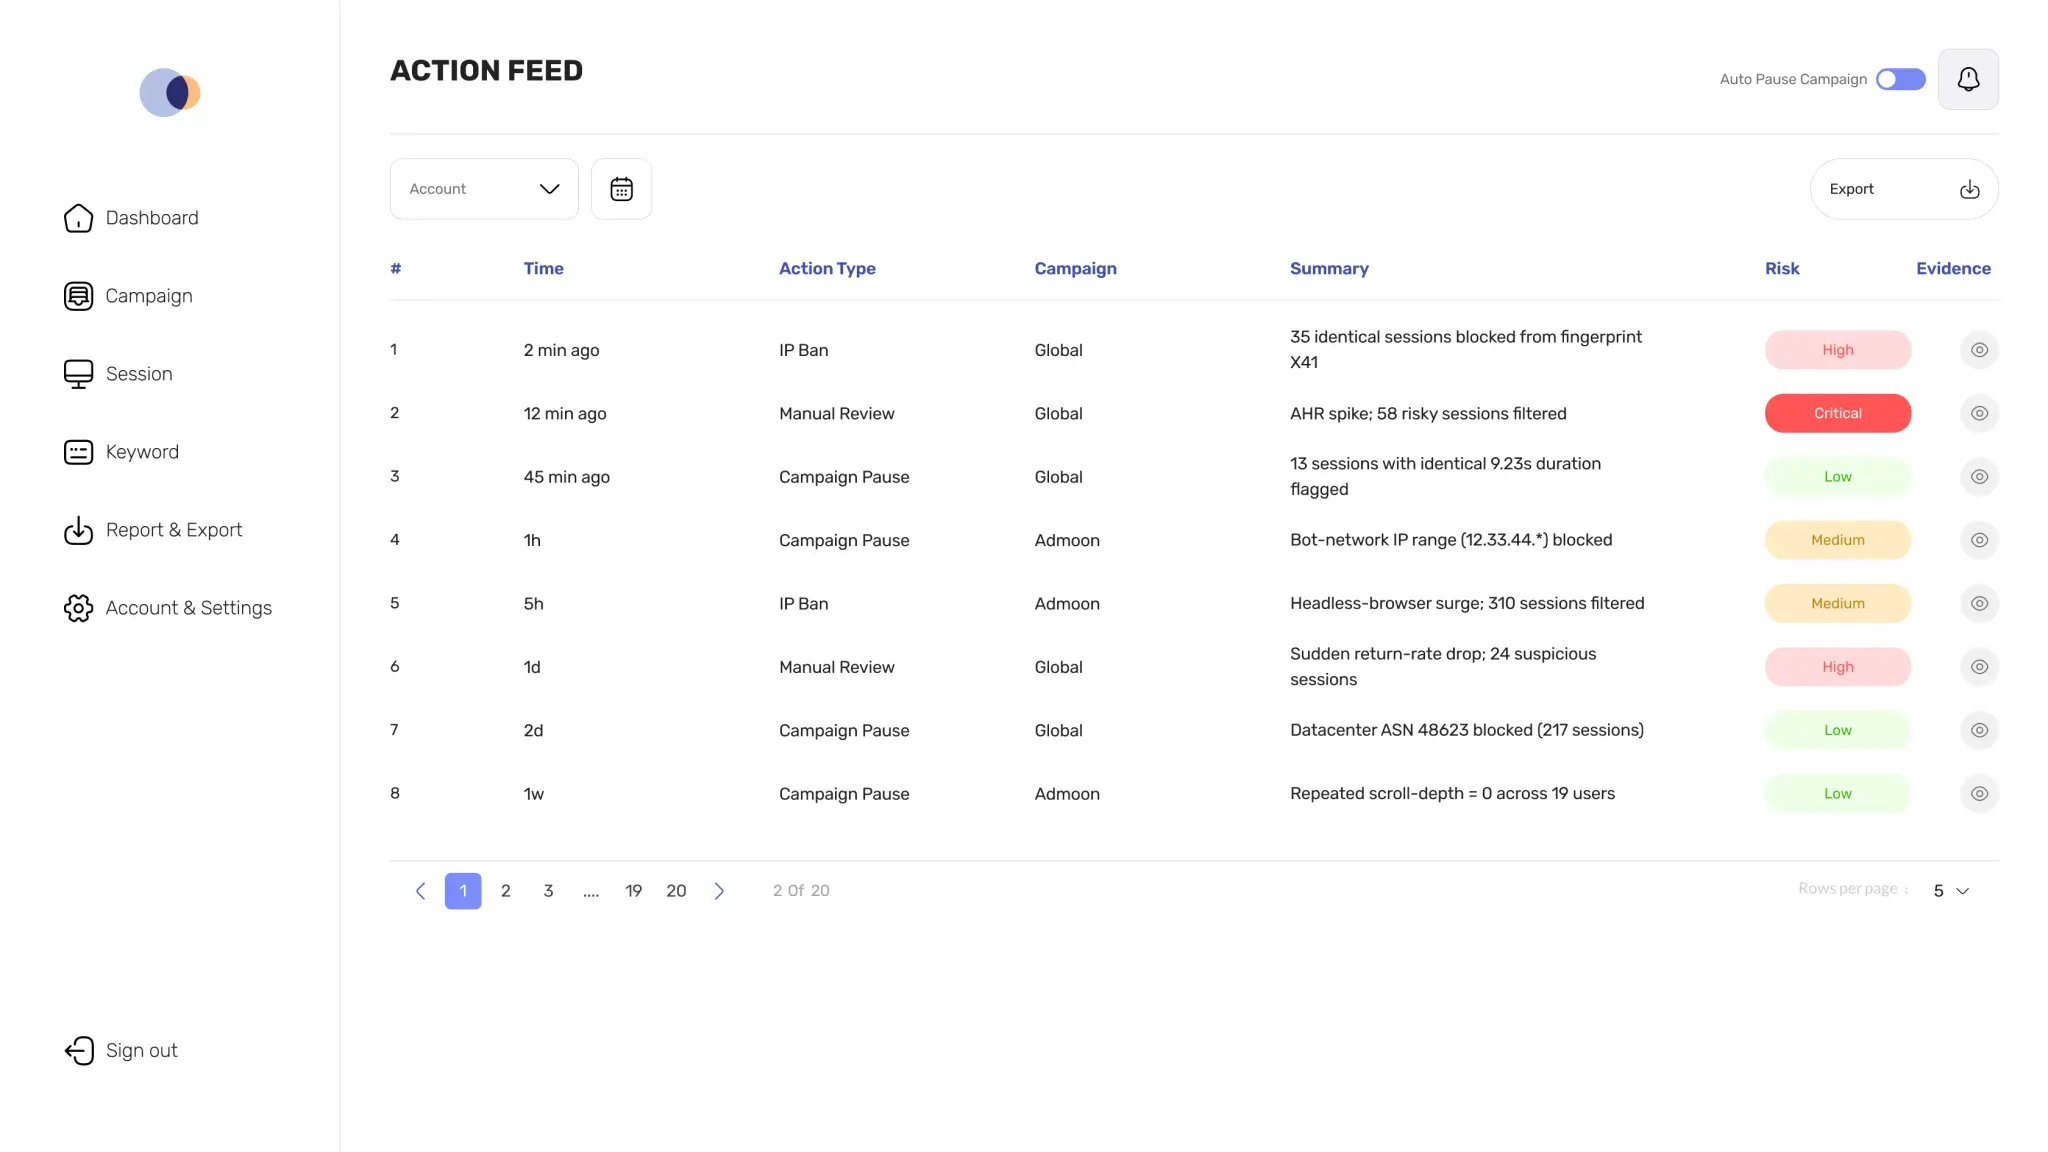
Real-time mitigation log streaming automated IP exclusions and rule execution. Batched via custom requestAnimationFrame hooks to sustain 60Hz UI fluidity under high-frequency event arrival.
Front-End Implementations & Core Highlights
High-Frequency Telemetry Stream Batching
Engineered an in-house requestAnimationFrame batching pipeline processing 50+ telemetry events per second at a stable 60Hz tick.
- ▸Eliminated React render queue exhaustion and input latency spikes under streaming loads
- ▸Buffered real-time Google Ads click events into synchronized microtask queues
- ▸Kept Interaction to Next Paint (INP) consistently below 160ms
Zero-CLS Adaptive Data-Density Toggle
Designed a seamless complexity switcher transitioning between simplified metric cards and dense analytical grids with zero layout shift.
- ▸Enforced shared CSS Grid track structures with explicit dimensional anchors
- ▸Leveraged CSS content-visibility hints for off-screen chart subtrees
- ▸Achieved a verified 0.00 Cumulative Layout Shift score in Lighthouse audits
Hardware-Accelerated Forensic Inspection Drawers
Constructed GPU-accelerated slide-over inspection overlays with accessible focus management and DOM virtualization.
- ▸Offloaded transitions to GPU compositor thread via CSS transform: translateX
- ▸Integrated accessible keyboard focus traps and ESC key dismissal listeners
- ▸Virtualized raw click payload logs for instantaneous opening without frame drops
Real-Time Protected Budget Computation Engine
Constructed client-side aggregate computation hooks continuously recalculating saved ad budget metrics via memoized selectors.
- ▸Multiplies blocked fraudulent sessions by real-time average CPC dynamically
- ▸Memoized selector derivations prevent redundant component re-evaluations
- ▸Provides instant feedback during date and threshold slider adjustments
Technical Trade-offs & Engineering Decisions
Every architectural choice balances runtime performance, team velocity, and production scale. Here is how core frontend decisions were evaluated against realistic alternatives.
State Architecture: Zustand vs Redux Toolkit
Zustand for transient drawer and view modes + TanStack Query for server cache
Redux Toolkit (RTK)
Ciaro's client state consists primarily of rapid transient UI controls (active evidence drawer, filter ranges, normal vs advanced view mode). Zustand eliminated action dispatch overhead, keeping the JS bundle footprint negligible while TanStack Query handled async server data fetching and cache invalidation.
Chart Rendering: ECharts SVG Renderer vs HTML5 Canvas
ECharts with SVG Renderer
HTML5 Canvas renderer
On high-DPI retina displays, canvas charts require manual device-pixel-ratio scaling hacks and cannot be styled via dynamic CSS variables. The SVG renderer provided razor-sharp vector curves, direct DOM accessibility attributes (ARIA), and seamless theme variable binding with lower memory overhead for analytics cards.
The Engineering Solution
Engineered a high-performance Next.js App Router dashboard using Zustand for transient UI states (drawers, filter queries, view modes) decoupled from the TanStack Query server cache. Implemented a custom requestAnimationFrame event-batching pipeline flushing telemetry at a stable 60Hz tick, rendered threat charts using ECharts SVG with React concurrent transitions, animated GPU-accelerated slide-over inspection drawers, and enforced fixed CSS Grid track anchors for zero Cumulative Layout Shift.
Next.js App Router with React Server Components & Client Boundaries
Zustand (Transient UI Controls) & TanStack Query (Server State Cache)
ECharts (SVG Vector Renderer with Dynamic CSS Theme Variables)
Tailwind CSS with Hardware-Accelerated Slide Drawer Overlays
Results & Takeaways
Buffering high-frequency streaming events via requestAnimationFrame guarantees steady 60Hz frame delivery without React render queue exhaustion.
Using Zustand for transient drawer states while delegating server synchronization to TanStack Query avoids unnecessary state machine complexity.
ECharts SVG renderer offers superior rendering quality, ARIA accessibility, and theme adaptability over Canvas for medium-density dashboard cards.